Publish custom metrics with Prometheus Pushgateway
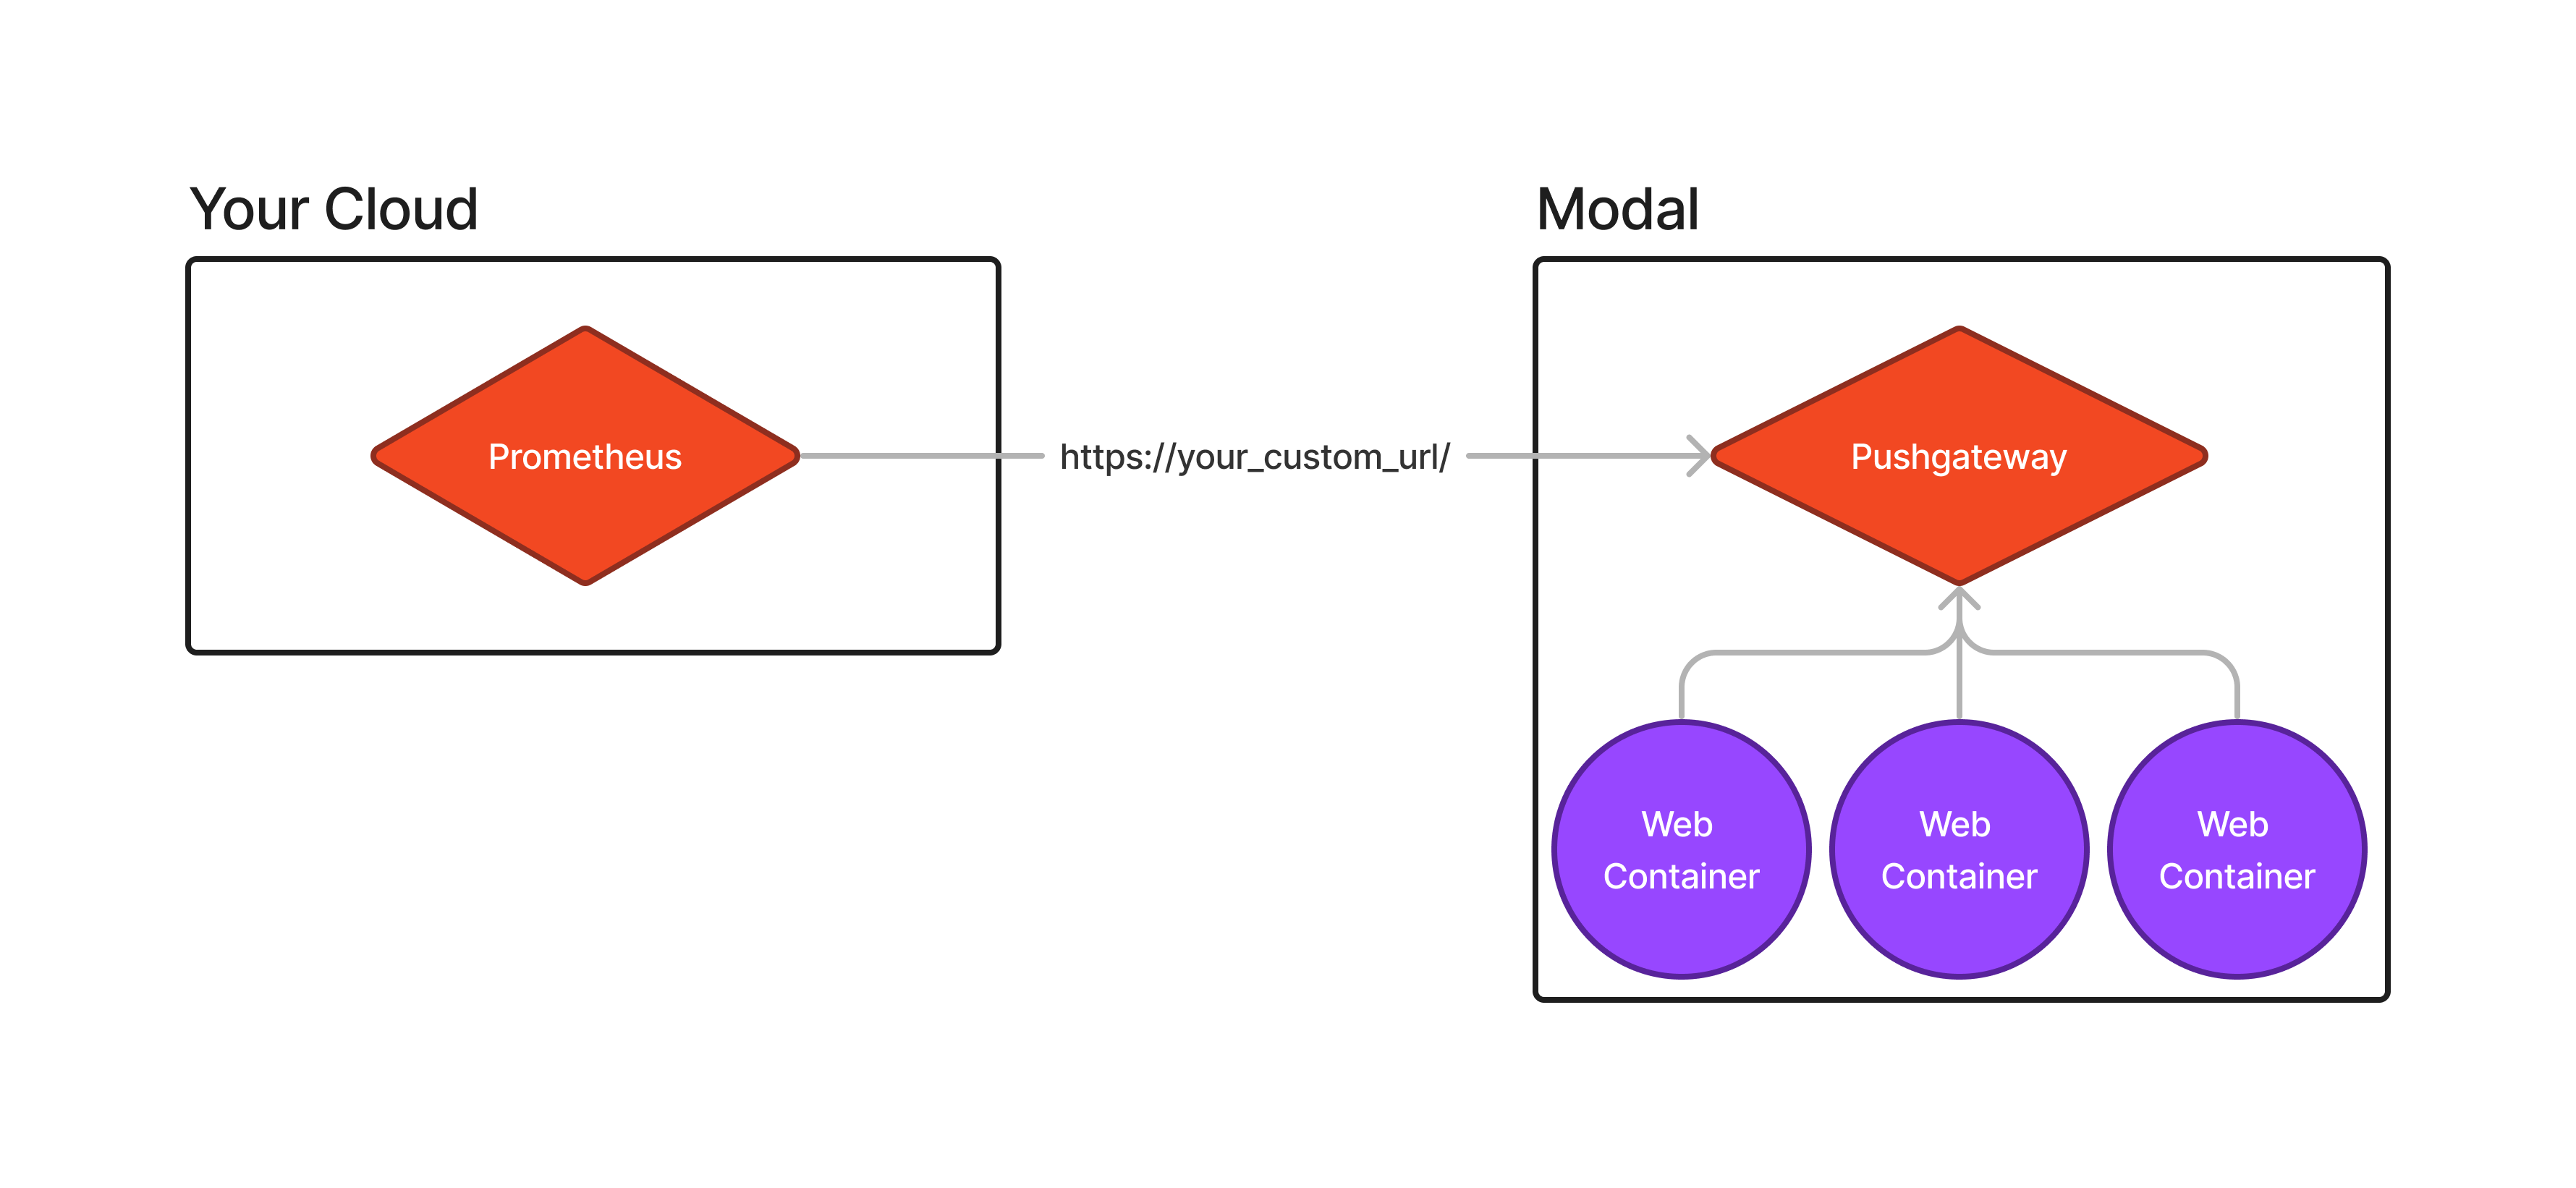
This example shows how to publish custom metrics to a Prometheus instance with Modal. Due to a Modal container’s ephemeral nature, it’s not a good fit for a traditional scraping-based Prometheus setup. Instead, we’ll use a Prometheus Pushgateway to collect and store metrics from our Modal container. We can run the Pushgateway in Modal as a separate process and have our application push metrics to it.
Install Prometheus Pushgateway
Since the official Prometheus pushgateway image does not have Python installed, we’ll use a custom image that includes Python to push metrics to the Pushgateway. Pushgateway ships a single binary, so it’s easy to get it into a Modal container.
import os
import subprocess

import modal

PUSHGATEWAY_VERSION = "1.9.0"

gw_image = (
    modal.Image.debian_slim(python_version="3.10")
    .apt_install("wget", "tar")
    .run_commands(
        f"wget https://github.com/prometheus/pushgateway/releases/download/v{PUSHGATEWAY_VERSION}/pushgateway-{PUSHGATEWAY_VERSION}.linux-amd64.tar.gz",
        f"tar xvfz pushgateway-{PUSHGATEWAY_VERSION}.linux-amd64.tar.gz",
        f"cp pushgateway-{PUSHGATEWAY_VERSION}.linux-amd64/pushgateway /usr/local/bin/",
        f"rm -rf pushgateway-{PUSHGATEWAY_VERSION}.linux-amd64 pushgateway-{PUSHGATEWAY_VERSION}.linux-amd64.tar.gz",
        "mkdir /pushgateway",
    )
)
Start the Pushgateway
We’ll start the Pushgateway as a separate Modal app. This way, we can run the Pushgateway
in the background and have our main app push metrics to it. We’ll use the web_server decorator to expose the Pushgateway’s web interface. Note that we must set max_containers=1 as the Pushgateway is a single-process application. If we spin up multiple instances, they’ll
conflict with each other.
This is an example configuration, but a production-ready configuration will differ in two respects:
You should set up authentication for the Pushgateway. Pushgateway has support for basic authentication out of the box. If you need more advanced authentication, consider using a Web Function layer that proxies requests to the Pushgateway.
The Pushgateway should listen on a custom domain. This will allow you to configure Prometheus to scrape metrics from a predictable URL rather than the autogenerated URL Modal assigns to your app.
gw_app = modal.App(
    "example-pushgateway-server",
    image=gw_image,
)


@gw_app.function(max_containers=1)
@modal.web_server(9091)
def serve():
    subprocess.Popen("/usr/local/bin/pushgateway")
Push metrics to the Pushgateway
Now that we have the Pushgateway running, we can push metrics to it. We’ll use the prometheus_client library to create a simple counter and push it to the Pushgateway. This example is a simple counter,
but you can push any metric type to the Pushgateway.
Note that we use the grouping_key argument to distinguish between different instances of the same
metric. This is useful when you have multiple instances of the same app pushing metrics to the Pushgateway.
Without this, the Pushgateway will overwrite the metric with the latest value.
client_image = modal.Image.debian_slim().uv_pip_install(
    "prometheus-client==0.20.0", "fastapi[standard]==0.115.4"
)
app = modal.App(
    "example-pushgateway",
    image=client_image,
)

with client_image.imports():
    from prometheus_client import (
        CollectorRegistry,
        Counter,
        delete_from_gateway,
        push_to_gateway,
    )


@app.cls()
class ExampleClientApplication:
    @modal.enter()
    def init(self):
        self.registry = CollectorRegistry()
        self.web_url = serve.get_web_url()
        self.instance_id = os.environ["MODAL_TASK_ID"]
        self.counter = Counter(
            "hello_counter",
            "This is a counter",
            registry=self.registry,
        )

    # We must explicitly clean up the metric when the app exits so Prometheus doesn't
    # keep stale metrics around.
    @modal.exit()
    def cleanup(self):
        delete_from_gateway(
            self.web_url,
            job="hello",
            grouping_key={"instance": self.instance_id},
        )

    @modal.fastapi_endpoint(label="hello-pushgateway")
    def hello(self):
        self.counter.inc()
        push_to_gateway(
            self.web_url,
            job="hello",
            grouping_key={"instance": self.instance_id},
            registry=self.registry,
        )
        return f"Hello world from {self.instance_id}!"


app.include(gw_app)
Now, we can deploy the app and see the metrics in the Pushgateway’s web interface.
$ modal deploy pushgateway.py
✓ Created objects.
├── 🔨 Created mount /home/ec2-user/modal/examples/10_integrations/pushgateway.py
├── 🔨 Created function ExampleClientApplication.*.
├── 🔨 Created web function serve => https://modal-labs-examples--example-pushgateway-serve.modal.run
└── 🔨 Created web function for ExampleClientApplication.hello => https://modal-labs-examples--hello-pushgateway.modal.run
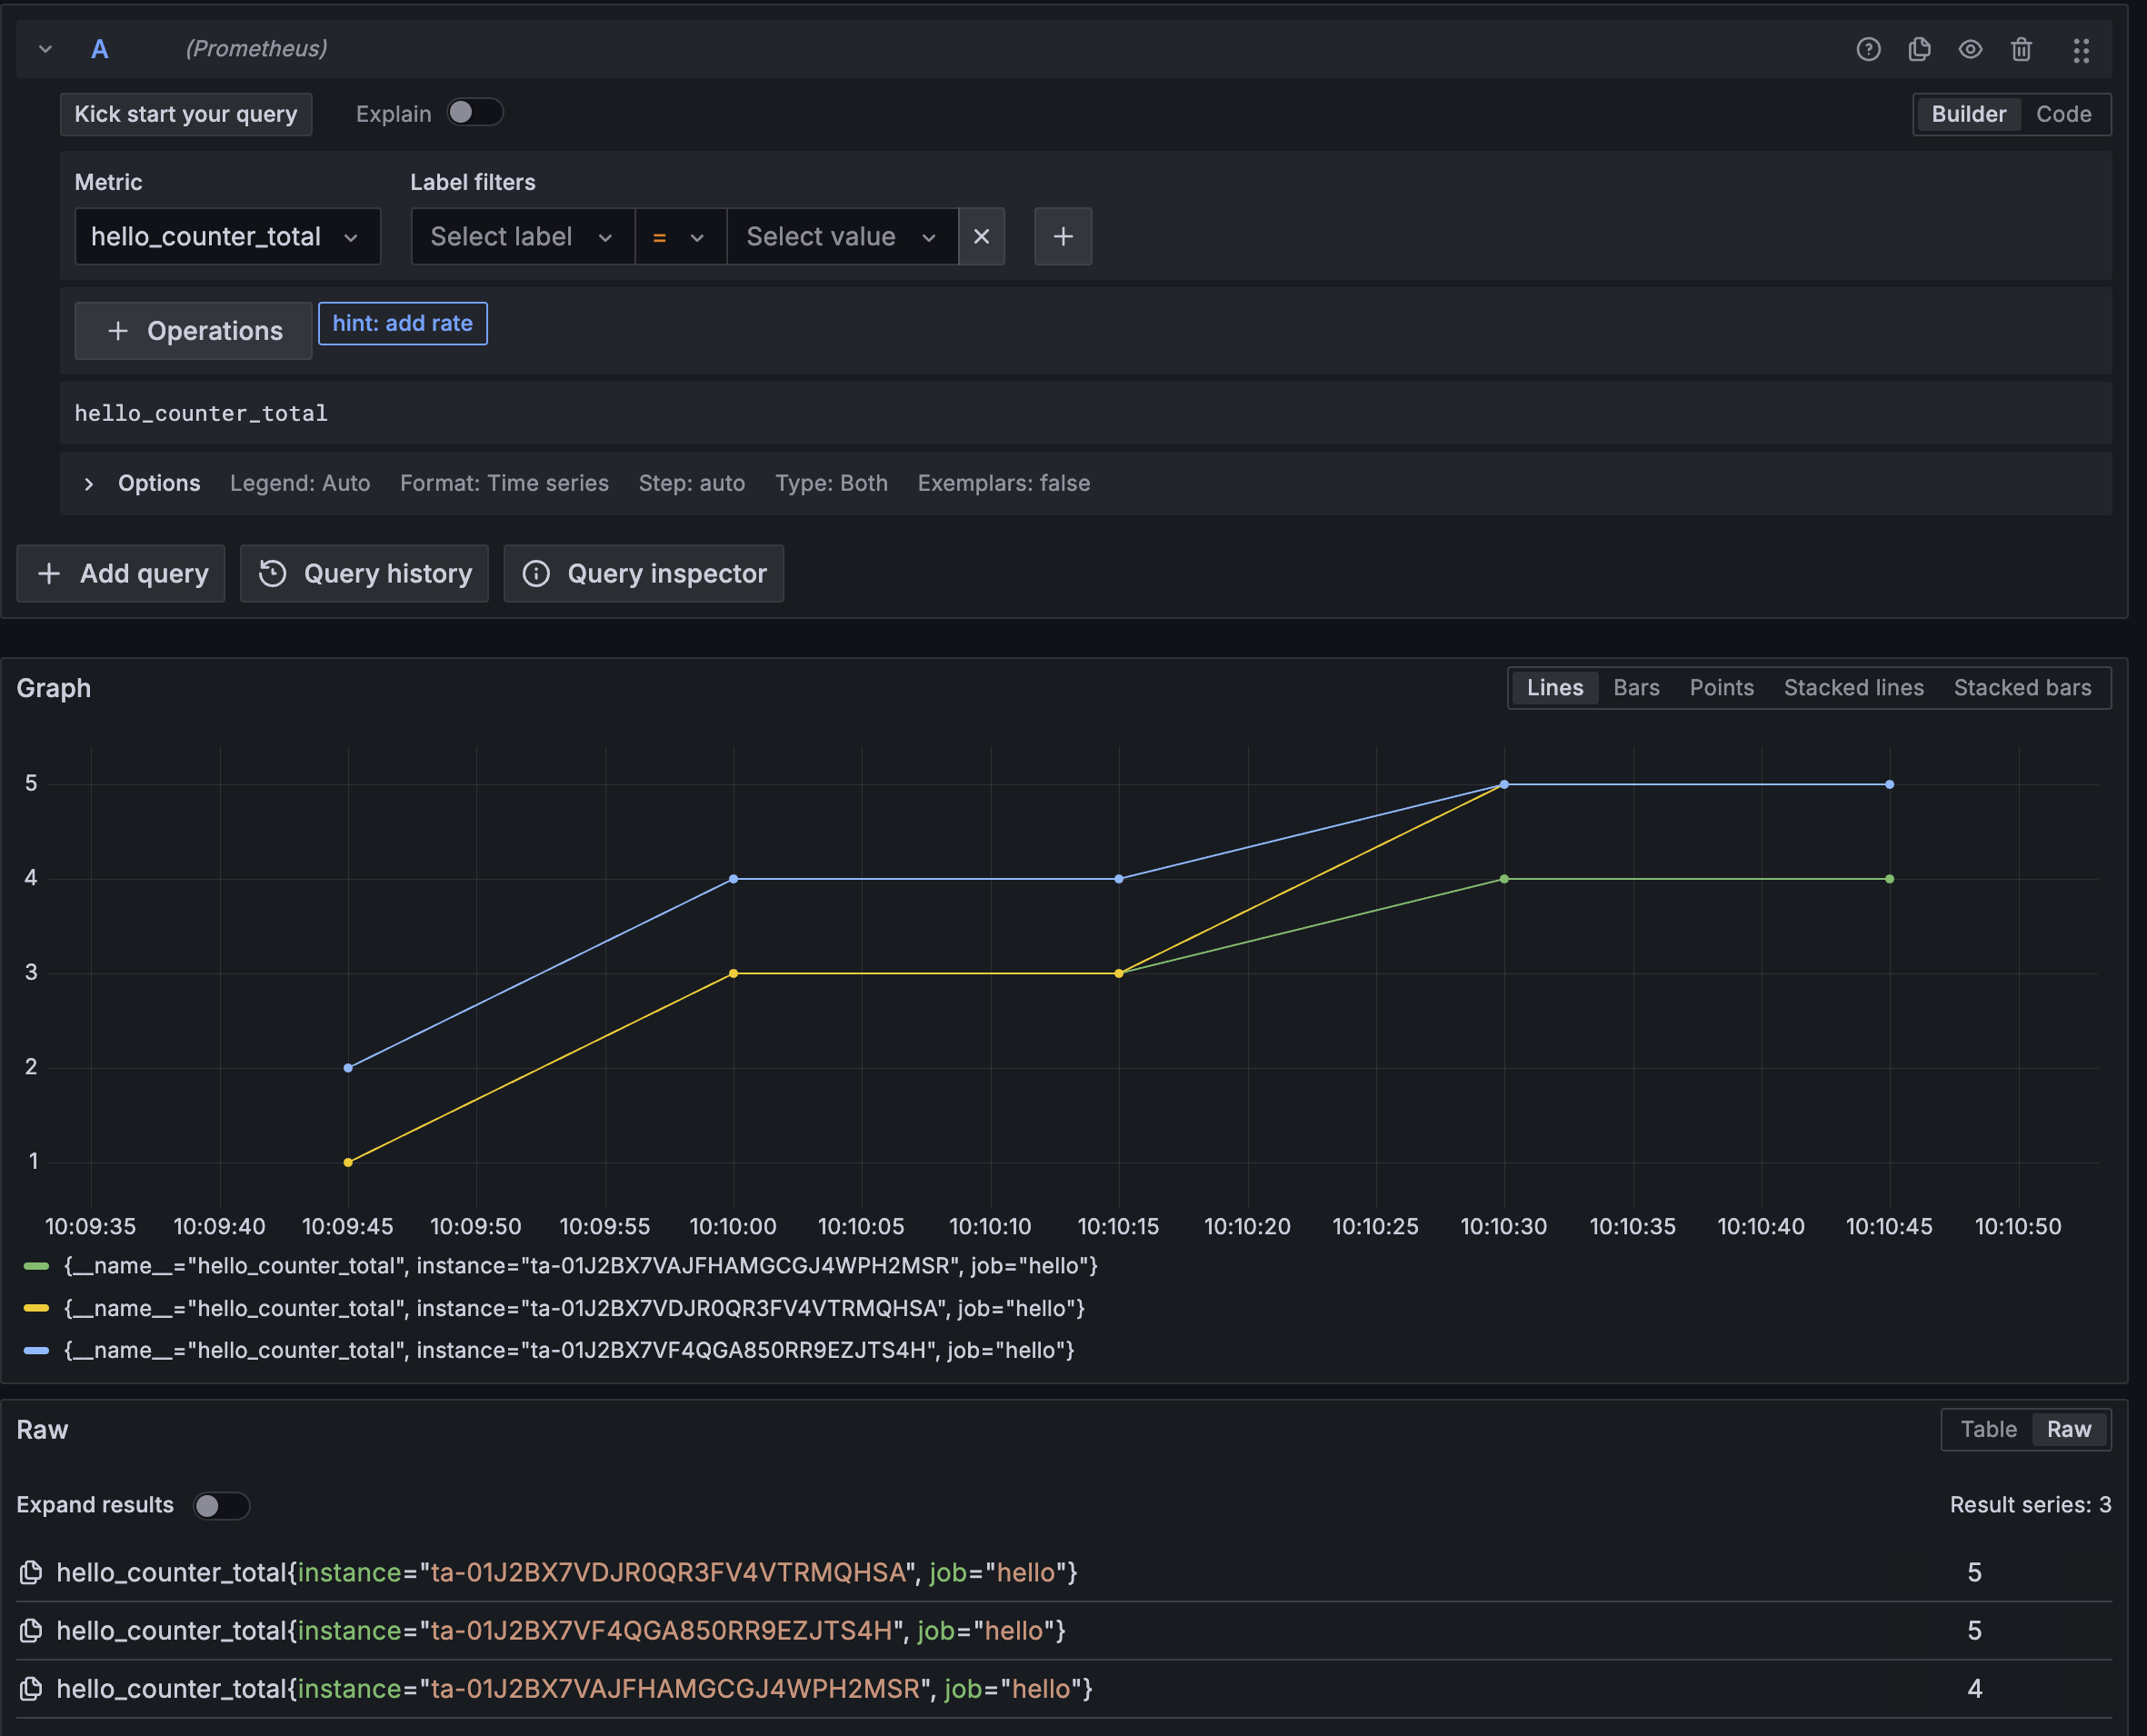
✓ App deployed! 🎉You can now go to both the client application and Pushgateway URLs to see the metrics being pushed.
Hooking up Prometheus
Now that we have metrics in the Pushgateway, we can configure Prometheus to scrape them. This is as simple as adding a new job to your Prometheus configuration. Here’s an example configuration snippet:
scrape_configs:
- job_name: 'pushgateway'
  honor_labels: true # required so that the instance label is preserved
  static_configs:
  - targets: ['modal-labs-examples--example-pushgateway-serve.modal.run']
Note that the target will be different if you have a custom domain set up for the Pushgateway, and you may need to configure authentication.
Once you’ve added the job to your Prometheus configuration, Prometheus will start scraping metrics from the Pushgateway. You can then use Grafana or another visualization tool to create dashboards and alerts based on these metrics!