Keeping 20,000 GPUs healthy
Modal runs a globally distributed, autoscaling GPU worker pool by sourcing compute from all cloud giants: AWS, GCP, Azure, OCI. We’ve scaled the worker pool to well over 20,000 concurrent GPUs, and launched over four million cloud instances in the last couple years. At this scale, you see almost every GPU reliability problem there is.
Today, we’re sharing our GPU reliability system as both a demonstration of our commitment to Modal customers and as a guide for fellow travelers renting hyperscaler or neocloud cards. It’s dangerous to go alone! Take this.
This post starts with cloud instance type testing and selection. Perhaps surprisingly, there are significant performance and reliability differences between the cloud hyperscalers. We then discuss machine image preparation and instance boot checks. Next we cover the passive and active GPU healthchecking performed throughout the life of each instance. Finally we discuss observability and support, which become crucial when a GPU reliability issue slips by our automated healthchecking systems.
We’ve chosen not to refer to cloud providers directly, but instead give them anonymized A, B, C, D identifiers. If you want know who’s who, track the clues or buy us a beer sometime.
Instance type testing and selection
Let’s start with cloud instance type reliability. The hyperscalers are significantly differentiated at the instance type level. To stick specifically to reliability related differences, we’ve observed that:
- Cloud A has the simplest and most reliable instance launch API. If you request a BM or VM and get a HTTP 201 back, 99.6% of the time you’ll get it to boot, and boot relatively quickly (2-3 minutes).
- Cloud A runs H100s which perform 50% worse on StableDiffusion
text2imgcompared with C and D. - Cloud C ran their H100s too hot, sometimes reaching over 90ºC, for a few months in 2025. FLOP/s performance degrades starting as low as the mid-70s Celsius.
- Cloud C has 228MiB more
reservedH100 memory than the others. Thus, it has less memory for our customers to use. - Cloud D A10s have frequent hardware-side clock slowdowns (
HW_SLOWDOWNandHW_POWER_BRAKE). - The NVIDIA A10s in one of Cloud D’s US regions have more frequent uncorrectable ECC errors. Unfortunately, this isn’t something you find out quickly.
- Cloud D has the best price/performance. Its bare metal servers are beasts.
Typically, our provider ranking is capacity and price led, but we additionally maintain internal adjusted prices which account for penalties we impose after discovering problems with specific instance types, regions, etc.
We maintain semi-automated benchmarking (called modal-host-bench) to let us evaluate the plethora of performance and reliability issues we want to eliminate or at least price-in. Here is some sample benchmarking data highlighting that you really do not want
to rent a PCIe H100 when you can rent an SXM H100 instead.
| Category | Cloud D H100 SXM | Cloud B H100 NVL (PCIe) | % diff |
|---|---|---|---|
torch_matmul_duration_seconds | 1.62 | 2.72 | 67.5% |
torch_matmul_flops | 678 TF/s | 405 TF/s | -40.3% |
h2d_bw_pageable_1024 | 7.68 GiB/s | 21.0 GiB/s | 174% |
h2d_bw_pinned_1024 | 49.1 GiB/s | 51.2 GiB/s | 4.40% |
d2h_bw_pageable_1024 | 14.3 GiB/s | 20.9 GiB/s | 46.0% |
d2h_bw_pinned_1024 | 50.7 GiB/s | 53.4 GiB/s | 5.30% |
Machine images
Machine images are what our bare-metal (BM) and virtual machine (VM) servers use to boot. They include a kernel, operating system files, the NVIDIA driver, installed system libraries, configuration, and a bit of Modal’s application software.
We’ve found that the quality of the machine images used has significant implications for reliability and performance. We care a lot about machine image consistency across our multi-cloud compute pool (same kernel, same drivers, etc) as well as freshness. Our images keep up with the latest production NVIDIA driver version (580.95.05) for security, performance, and new features.
In Modal’s early days, machine image updates were ad-hoc and manually tested, and mistakes abounded. A couple years ago this became untenable, so we switched to continuous, gradual integration of machine images with automated testing before image promotion occurred.
Because the cloud giants are so reliable at loading custom machine images, you can pull a lot of GPU testing into the image build phase. Concretely, at the end of a build we run both system tool tests like NVIDIA Data Center GPU Manager (DCGM) and custom GPU tests from inside the Modal container runtime before considering the image configuration ready for production. This ensures that both the Worker host and our customer’s guest containers will work with the GPU.
provisioner "shell" {
  script = "./setup/check_nvidia_ctk.sh"
}

provisioner "file" {
  destination = "/tmp/modal/"
  source      = "./.bin/modal-healthcheck"
}
Solid machine image support is a place where the cloud giants clearly differentiate their platforms from most neocloud upstarts (e.g. Lambda Labs, Nebius). Very few neoclouds support image customization, and they also have worse instance startup performance due to hypervisor and caching inefficiencies. Cloud C is the fastest to boot a new VM with our machine image, averaging just under 2 minutes. Certain neoclouds struggle to boot even their platform-default machine image in less than 5 minutes.
Although the hyperscalers are not significantly differentiated in their machine image feature and reliability, cloud D has extremely slow regional image replication, taking 3 hours to replicate to 10 regions.
Instance boot
Instance boot is where our machine images spark alive in the heat and noise of a datacenter, encountering the reality of production. If we’ve booted on a host with bad GPUs, or our cloud-init process has a bug, we need know about it and intervene before any customers land on those GPUs.
There is a significant tradeoff here. Modal runs an autoscaling fleet. Slowing down startup adds to scheduling overhead for our customers. Worse still, added startup latency actually reduces reliability when it delays failover.
The deepest generic check you might do on a new host is dcgmi diag --run 4. It finds a bunch of long-tail problems, but takes around an hour. Even the shallowest, dcgmi diag --run 1 takes at least a minute.
Testing hardware on boot is likely redundant with healthchecking already performed by the cloud provider. After all, we’re supposedly paying for working GPUs! Deeply checking every instance put out by an assembly line already running at four nines of reliability would be penny wise and pound foolish. When I buy a coffee at my local shop, I don’t ask to smell the milk.
So at instance boot we typically perform relatively light checks: systemctl queries, nvidia-smi queries, and a basic readwrite on a randomly selected GPU (0-7).
Today, we almost never have GPU problems slip through and hit user containers. The one irksome issue we have in production is that Cloud C’s L4s flake at CUDA initialization in 0.1% of cases. Application code targeting those cards must use cuInit retries.
Lifetime management
At this point we’ve acquired an instance we’re happy with, booted it, and started running customer workloads on it. We’re happy in production, but need to stay that way, and that’s where continuous passive and active healthchecking comes into play.
- Passive healthchecking does not run on a GPU and is non-invasive, read-only. Passive data streams include
dmesganddcgmi health. - Active healthchecks take exclusive hold on a GPU device and readwrite to acquire health data.
dcgmi checkandnvbandwidthare examples.
Passive healthchecking
You get 80% of the passive healthchecking wins from 20% of the work: running dcgmi periodically and checking dmesg for the most common issues. More specifically, dcgmi can tell you about uncorrectable ECC errors on specific GPUs. We can also passively learn of GPU thermal violations, sync boost violations, hardware slowdowns, and excessive temperatures (> 88°C).
As mentioned above, cloud C had a big cooling problem until a few months ago. We’ve seen cloud C GPUs get to 94°C! Performance is crippled at that temperature, around 50% of peak. 🥵
Active healthchecking
As active healthchecking requires an exclusive lock on GPUs, it is more complicated to schedule. Overuse active healthchecking and we waste valuable GPU time. Underuse it and we risk leaving around degraded GPUs.
Following SemiAnalysis’s ClusterMAX expectations, we ensure that each GPU node gets deep, active checking at least weekly. Though we’ve confirmed our underlying cloud providers perform their own deep active healthchecking, they obviously can’t do their checking while we hold the instances.
A lot of our instance capacity is via short (<24hr) rentals, so we don’t encounter this as much as platforms that rent machines for months. However, we do have some longer-lived capacity. Every week we hold an instance, we run the following active checks:
- NVIDIA DCGM
diaglevel 2. - GPUBurn/GPU-fryer - to validate the GPU won’t fail under load.
- Local NCCL all-reduce tests to validate NVLink/NVSwitch/NVLink SHARP performance.
If these fail, we are alerted, the instance is not allowed to proceed to accepting tasks, and sometimes we “quarantine” the instance for analysis by ourselves or the underlying provider.
In the near future, we are adding these network-oriented active checks due to increasing interest in fast interconnect for training and inference:
- Local InfiniBand all reduce test for validating InfiniBand performance and links (by force disabling NVLink/p2p/SHM).
- Pairwise CPU and GPU
ib_write_bwandib_write_latencybidirectional tests to verify that the network is within specs with reference numbers.
Taking action
In theory it’s possible to recover from some unhealthy GPU states by isolating and resetting the GPU. In practice, for us, this is overcomplicated and no guarantee of recovery. So instead we automatically mark the entire host unhealthy, drain it, and then either dispose of it or reinstall.
Observability
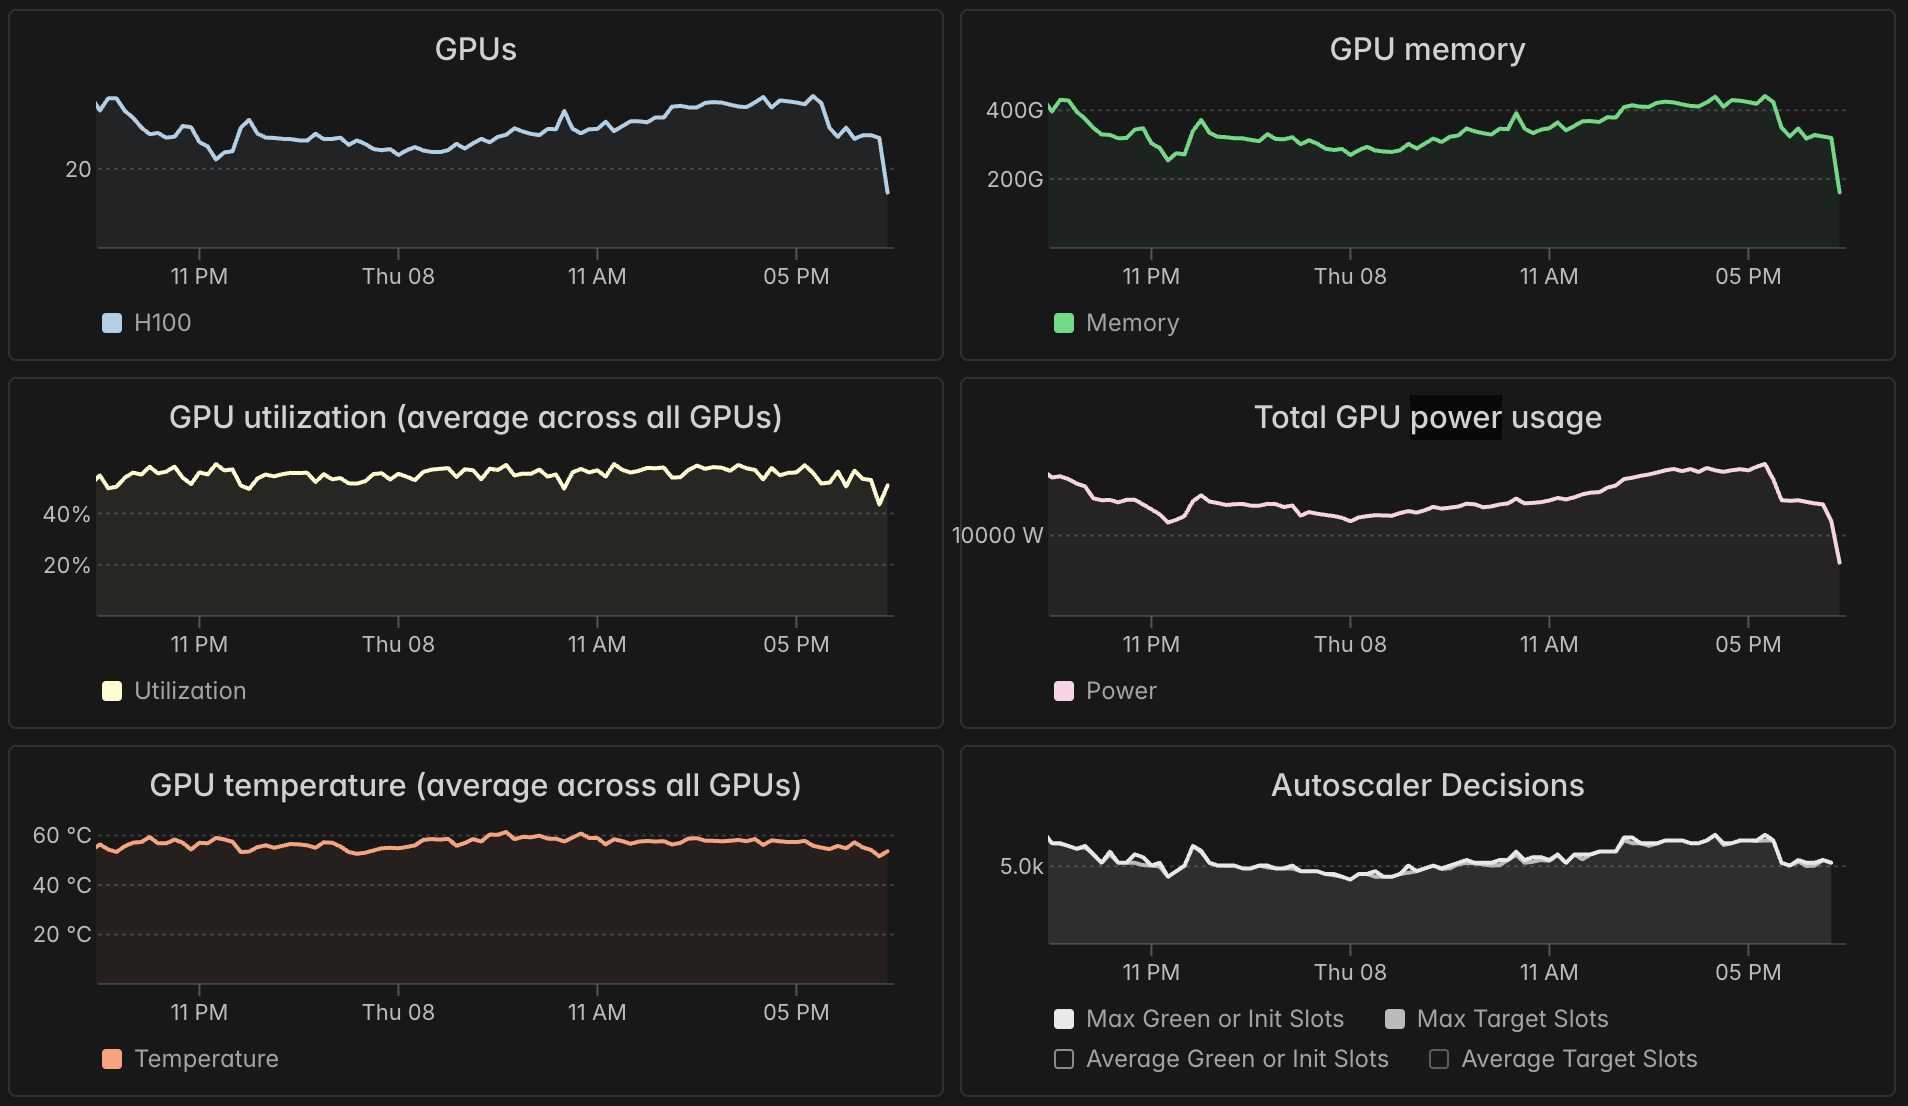
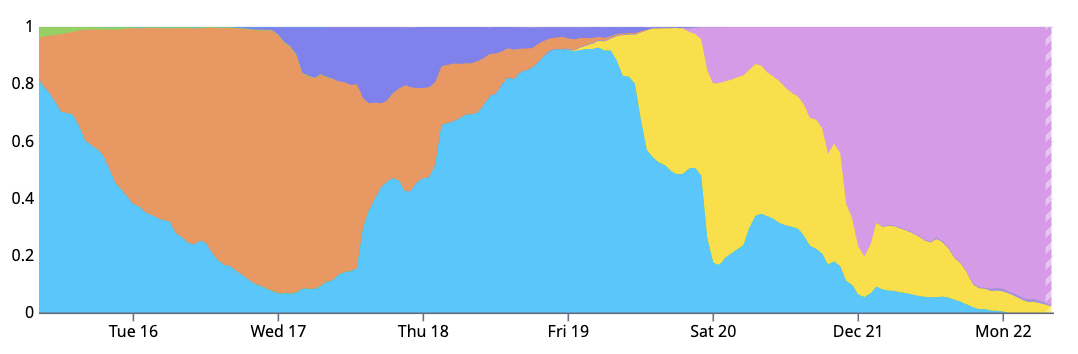
Our dashboard offers every container a view of its GPU reliability via four metrics:
- memory usage
- utilization
- temperature
- power usage
For lots of detail on how to interpret these, see our previous high-level guide to GPU utilization.
A caveat is that all of these metrics are currently aggregated at the container level, so they are less effective at spotting a single bad GPU amongst eight.
Going beyond metrics, we also pipe abnormal GPU health events into dashboard container logs. See the informational “gpu-health” lines in the screenshot below (indicated with purple).
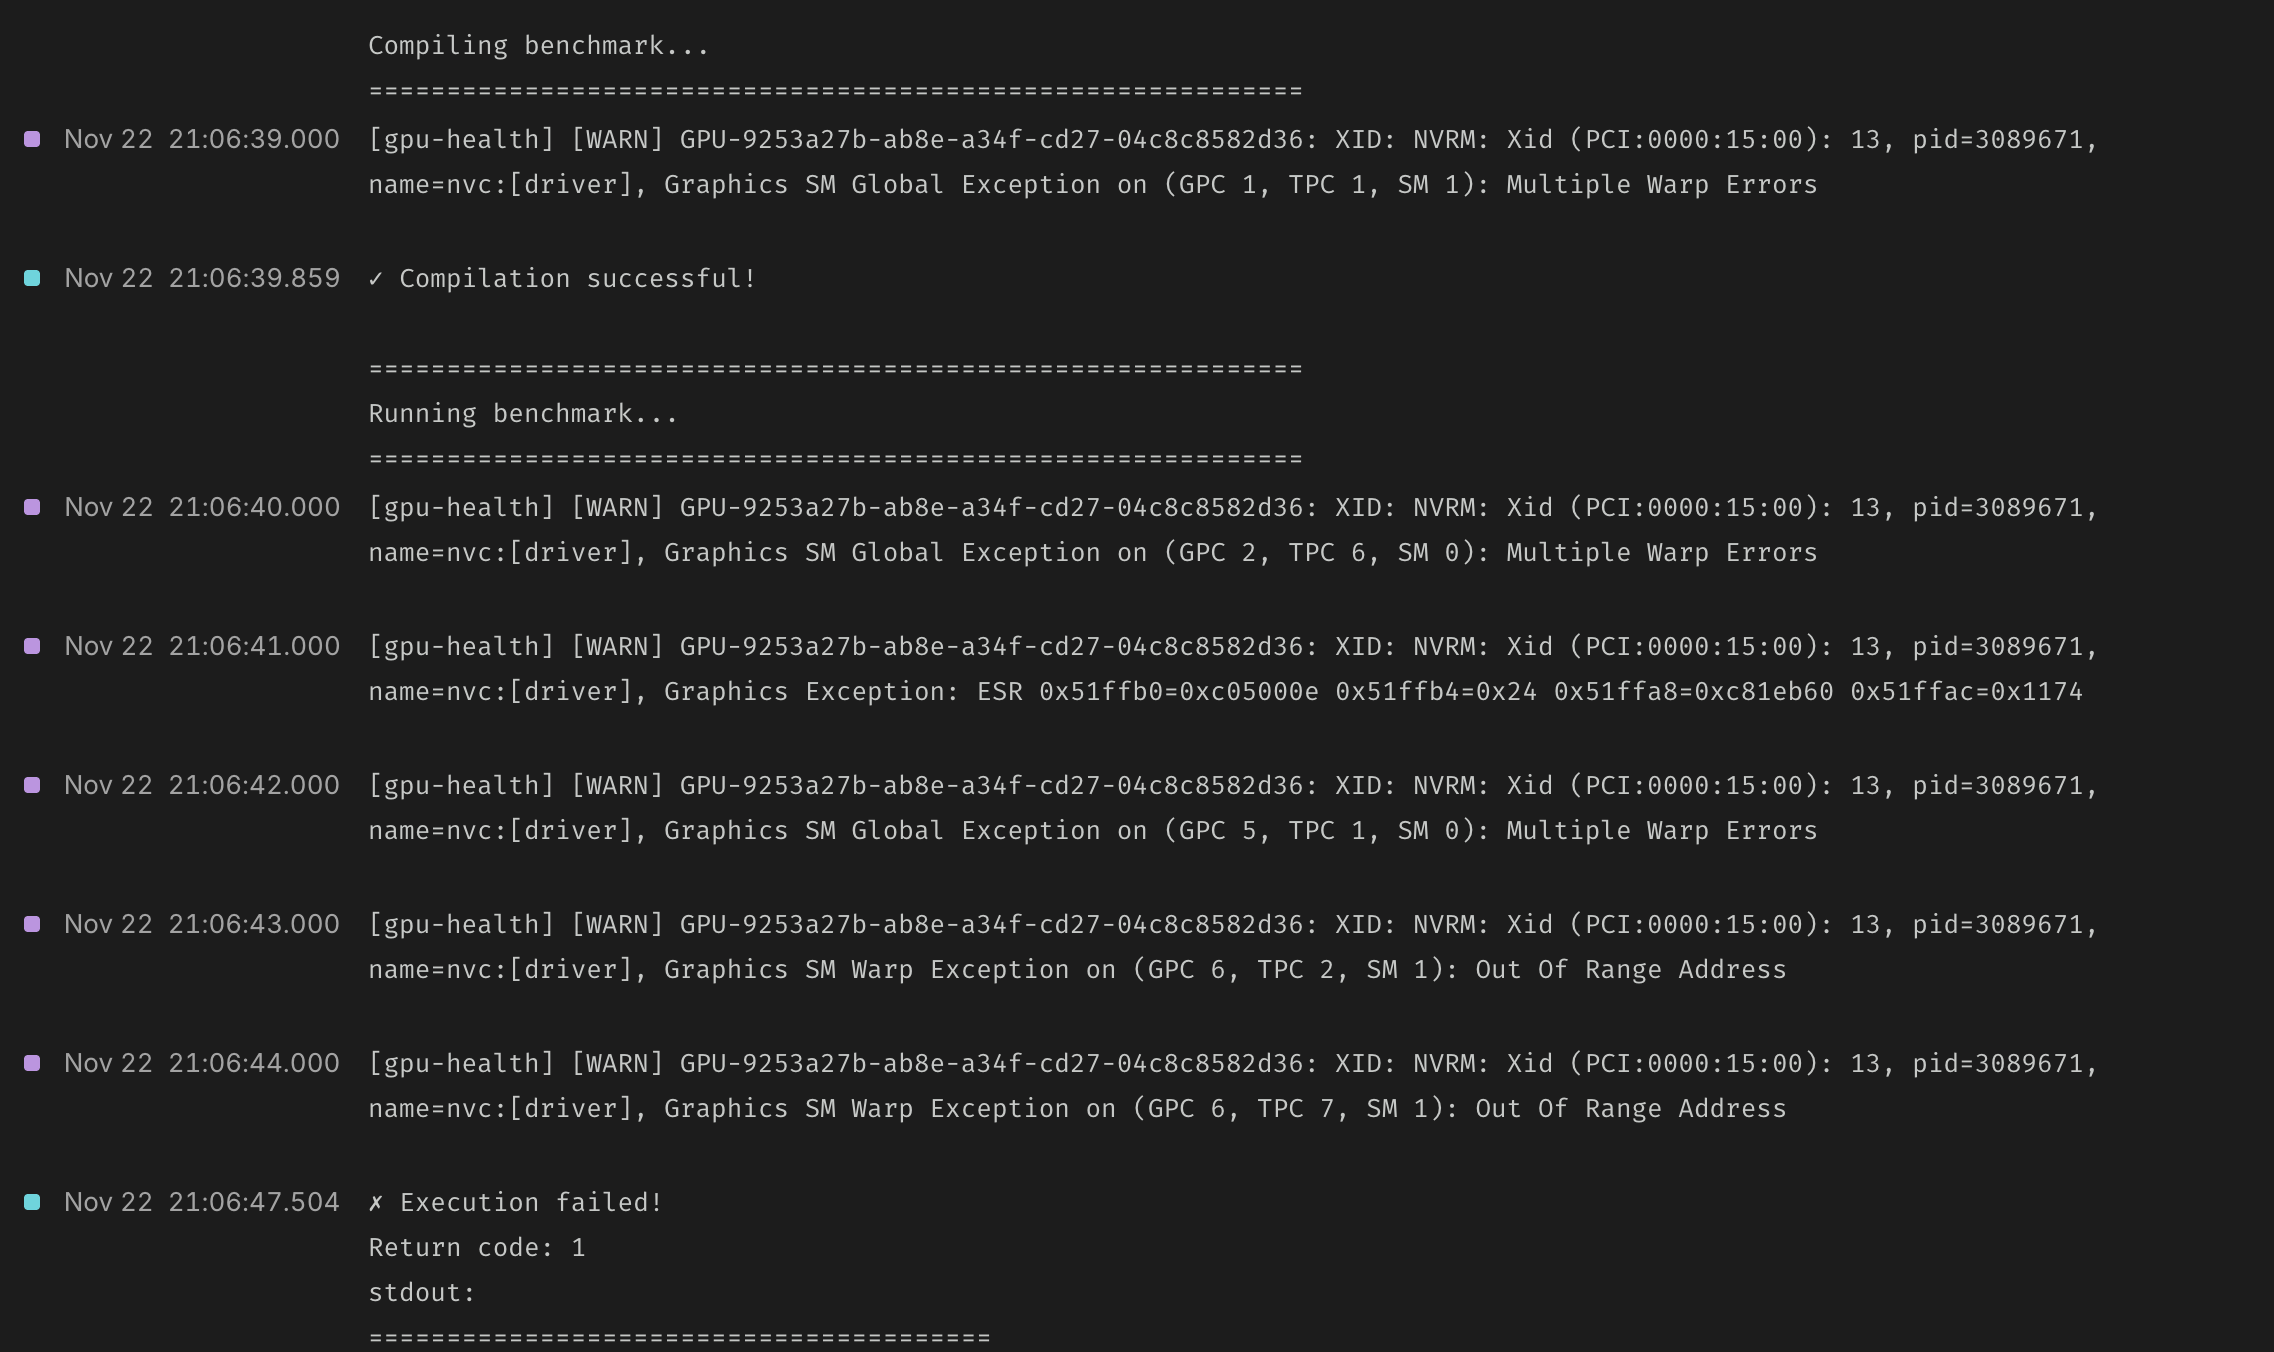
Our guide documentation maintains a detailed Xid and sXid dictionary for understanding errors. We think it’s the best GPU error resource on the internet.
Support
All the above comfortably gets you four nines of GPU uptime. But there’s always edge-cases and black swans—for those you need support.
For our Enterprise customers we use a shared private Slack channel with tight SLAs. Slack is connected to Pylon, tracking issues from creation to resolution. Because Modal is built on top of the cloud giants and designed for dynamic compute autoscaling, we can replace bad GPUs pretty fast!
For everyone else we are still responsive in our community channels, and offer credits when we let a GPU go bad without noticing.
Conclusions
It’s underappreciated how unreliable GPUs are. NVIDIA’s hardware is a marvel, the FLOPs are absurd. But the reliability is a drag. A memorable illustration of how AI/ML development is hampered by reliability comes from Meta’s paper detailing the training process for the LLaMA 3 models: “GPU issues are the largest category, accounting for 58.7% of all unexpected issues.”
Imagine the future we’ll enjoy when GPUs are as reliable as CPUs. The Llama3 team’s CPUs were the problem only 0.5% of the time. In my time at Modal we can’t remember finding a single degraded CPU core.
Until then though, what you’ve read is our commitment to being your GPU reliability team. If you go at it alone, don’t say you weren’t warned.